
Welcome!
This executive summary presents an overview of EPA’s most recent Toxics Release Inventory (TRI) data, based on the detailed information found in EPA's TRI National Analysis website (link opens in a new tab or browser window). Congress established the TRI to ensure that every community is empowered with access to information on the toxic chemicals handled and released at nearby facilities. TRI includes annual data submitted by industry on how chemical wastes are managed, including those that are released to the environment.
The TRI National Analysis is EPA’s presentation of the most recent data.
The National Analysis is part of EPA’s commitment to transparency and enhances public understanding of the TRI data by:
- Summarizing reported data on releases and other waste management practices of toxic chemicals, and providing trend analyses of these data; and
- Providing interactive tools that support access to and exploration of TRI data.
- Visit the full TRI National Analysis (link opens in a new tab or browser window) to learn more.
21,087 facilities reported to TRI for 2021.
Facilities in industry sectors such as manufacturing, electric power generation, and mining have until July 1 of each year to submit data from the previous calendar year. These data then undergo quality reviews by EPA. Use this map to see the TRI information submitted by individual facilities.
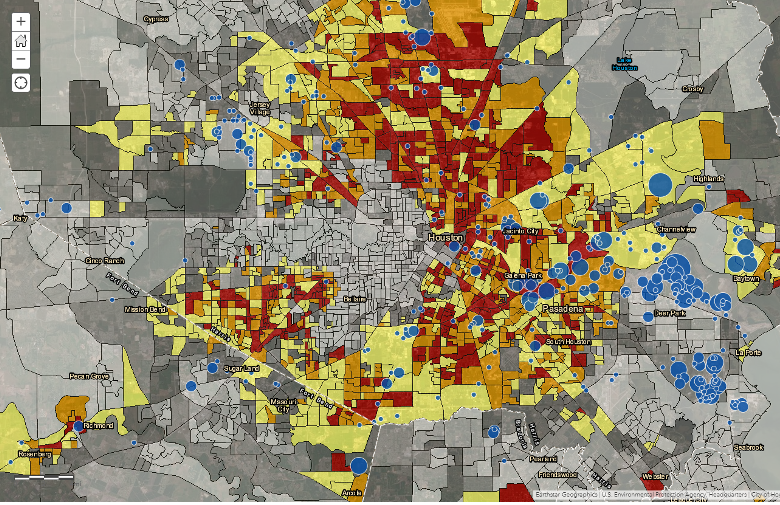
View the demographics of the communities where TRI facilities are located.
The TRI National Analysis includes the option to view the demographics of the communities where TRI facilities are located. For example, in the default view, the red, orange, and yellow shading indicates an area’s “Demographic Index” is high compared to other communities in the country. The Demographic Index is a national percentile based on the average of two metrics: Percent People of Color and Percent Low Income. Each blue dot represents a TRI facility. Explore your area by selecting the "Community Profile" option in the Where You Live tool of the TRI National Analysis.
Since 2012, releases to the environment have decreased by 10%, with reductions across all media.
- For 2021, TRI facilities reported 3.3 billion pounds of releases to air, water, and land.
- Land disposal, largely from metal mining, accounted for 65% of releases.
- From 2020 to 2021, releases of TRI chemicals increased by 8% (233 million pounds).
- Releases decreased from 2019 to 2020 and releases in 2021 were similar to those reported in 2019, indicating that the increase in releases from 2020 to 2021 may have been due to a temporary reduction in releases in 2020, related to the Covid-19 public health emergency.
- Learn more about releases reported to TRI (link opens in a new tab or browser window).
Long-term declines in air emissions reported to TRI are one driver of decreased total releases.
- Air releases decreased by 26% (204 million pounds) from 2012 to 2021.
- Almost all sectors reduced their air emissions since 2012, with the largest reduction coming from the electric utilities sector.
- Air emission reductions by electric utilities were largely due to: decreased emissions of hydrochloric acid and sulfuric acid; a shift from coal to other fuel sources (e.g., natural gas); and the installation of control technologies at coal-fired power plants.
- Releases to air of ammonia, methanol and sulfuric acid accounted for almost half of all air emissions reported to TRI for 2021.
- Learn more about air emissions reported to TRI (link opens in a new tab or browser window).
89% of the TRI chemical waste that facilities managed was not released due to preferred waste management practices such as recycling.
- In addition to quantities released, facilities report the quantities of TRI-listed chemicals that they manage through preferred methods including recycling, combusting for energy recovery, and treatment.
- Since 2012, production-related waste managed increased by 5.3 billion pounds (22%), driven by increased recycling.
- Learn more about waste management practices reported to TRI (link opens in a new tab or browser window).
TRI facilities implemented 3,490 new source reduction activities in 2021 to reduce pollution at its source.
- Source reduction success stories presented in the National Analysis highlight effective practices that other facilities can replicate. EPA's TRI Pollution Prevention (P2) Search Tool (link opens in a new tab or browser window) promotes these opportunities for knowledge transfer by allowing users to search for source reduction activities that might be relevant to their operations.
- The figure summarizes the most frequently reported source reduction activities for the chemicals and industry sectors with the highest source reduction reporting rates over the last 5 years. Facilities most commonly reported improvements to Operating Practices and Training – such as changing production schedules to minimize equipment changeovers–and Process and Equipment Modifications – such as optimizing process conditions to increase efficiency.
- Learn more about source reduction activities reported to TRI (link opens in a new tab or browser window).
Each year, the TRI National Analysis examines key industry sectors.
Choose from the industry sectors to the right to learn more about their TRI releases.
- Since 2012, releases by manufacturing facilities decreased by 6%. This is primarily due to reductions in air releases.
- Manufacturing facilities reported initiating more than 3,200 new source reduction activities during 2021 to reduce TRI chemical use and waste generation.
- Learn more about sector-level TRI reporting (link opens in a new tab or browser window).
Social Media
Use the share button at the top to share this report with others and follow the latest EPA activities to protect human health and the environment.
Contact Us (link opens in a new tab or browser window) to ask a question, provide feedback, or report a problem.